Summarise the information by selecting and reporting the main features, and make comparisons where relevant.
Прежде всего, для описания этого bar chart нужно решить, по какому принципу мы будем группировать данные. Вариантов несколько:
1. Самый простой — параграф про девочек и параграф про мальчиков. Всё просто и понятно, но как-то очень скучно.
2. Группировка по экзаменам, где девочки с мальчиками показали одинаковые результаты (Mathematics, Foreign Languages, History, Physics) и где результат отличался (все остальные)
3. Разделение дисциплин на наиболее успешные (Computer Science, Math) и наименее (History, Chemistry)
Мы выбрали второй вариант. Однако при любом способе группировки, главное — не описывать все данные. Упоминайте лишь самые выдающиеся цифры, иначе ваша работа будет похожа на таблицу в Экселе — от чисел заколет в глазах.
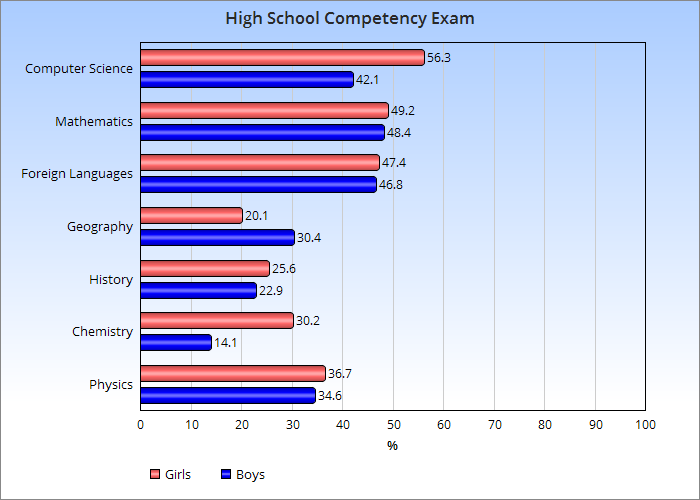
The given picture illustrates data on the volume of examinees who successfully passed their competency tests in the academic year of 2010-2011. The information is given on boys and girls separately.
According to the bar chart, students of both genders showed virtually the same results in the major part of the disciplines. Mathematics was the exam in which both boys and girls scored comparatively high at 49,2% for girls and 48,4% for boys. On the other hand they displayed the lowest success rate in history with 25,6% and 22,9% respectively.
At the same time, there were some subjects in which male and female students were not equally successful, namely chemistry, geography and computer science. In case of chemistry the percentage of girls who passed the exam was twice as high with 30,2% and 14,1%. The only exam which was passed by boys better than girls was geography at 30,4% and 20,1% respectively. (169 words)
В данном случае мы включили заключение в тело последнего параграфа. Написав полноценный абзац, мы бы сильно превысили требуемый объём текста (150 слов)