The graphs below provide information on global population figures and figures for urban populations in different world regions.
Summarise the information by selecting and reporting the main features, and make comparisons where relevant.

(Courtesy of ielts-exam.net)
The given graphs demonstrate us how human’s population have1 changed for the last three centuries and how, according to predictions, it will change2 in future.
Looking at the first line we can claim that it has grown steadily since 1800 when there were 1000 million of people to 1950 with the number of 2500 million. Then it skyrocketed and the figures have risen more than three times by 2020 when the world population was3 already 7500 million. According to this graph, scientists predict that human’s number will slow its growth in the next 20 years and they believe that there will be a decline after 2040 so only 6000 million4 of people will live on Earth in 2100.
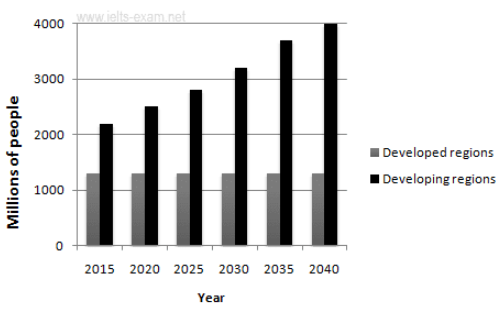
The other diagram shows a difference in the number of citizens leaving in developed and developing regions. We can mention that in 2015 there were slightly more than 2000 million of developing regions habitants and this amount has been growing and will reach its peak by 2040. On the contrary, bar chart representing how many individuals live in developed regions remain constant during the whole period.
184 words
Нумерация ошибок соответствует маркировке в тексте. Рекомендуемые исправления и изменения в тексте подчёркнуты.
- … population has changed
- … it is projected/going to change in the future — подобное использование will подразумевает, что прогноз не основан на каких-то данных, хотя по логике он базируется на чём-то.
- Рекомендую использовать более разнообразные структуры, когда речь идёт о цифрах — например ‘reached’, ‘hit’, ‘peaked at’ и там далее.
- Можно чередовать с billion(s).
Хорошая работа, которой не помешает некоторое разнообразие в структурах описания цифр и уровней. Также, помним главное правило — из описания у прочитавшего должно сложиться чёткое представление о всей картине, представленной на графике.
В последнем предложении желательно всё же добавить цифру, на которой осталось население развитых стран.
| Аспект | Оценка |
| TA | 7.0 |
| C&C | 7.0 |
| Grammar | 7.5 |
| Vocabulary | 6.5 |
| Общая оценка: 7.0 Критерии оценки |
|