The graphs below provide information on global population figures and figures for urban populations in different world regions.
Summarise the information by selecting and reporting the main features, and make comparisons where relevant.

(Courtesy of ielts-exam.net)
The first of the given graphs provides information about demographic realities in the world over the period of 300 years, while the second one demonstrates the amount of inhabitants in areas with different levels of living from 2015 to 2040. The following units are used in millions.
Concerning the line graph, the most noticeable trend is that since 1800 the world population has been increasing. In 1800 the figures began to rise from 1000 million and eventually reached its high in 2050 (around 8 million)1. After 2050 the indices started to decrease showing a downward movement.
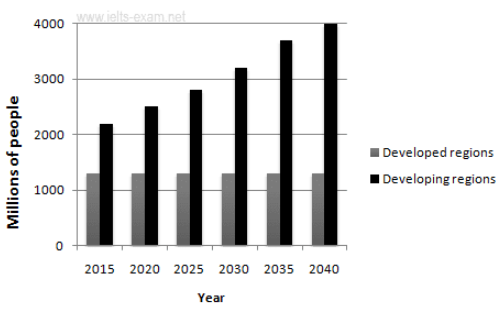
As for the bar chart, the number of people living in developing countries also tends to grow: within 25 years the population rose by 1900 million, while the situation in the developed regions have2 been largely unchanged. During the quarter of a century rates have levelled off, constituting around 1300 million of people.
In summary, it is evident that both graphs follow a similar pattern of the growth of the human population.
Нумерация ошибок соответствует маркировке в тексте. Рекомендуемые исправления и изменения в тексте подчёркнуты.
- Желательно не использовать скобки, ведь тем самым вы забираете у себя возможность показать ваше владение предлогом (Здесь — «… reached its high in 2050 at/of/with around 8 million». Не ошибка.
- Согласование со словом situation, а не со словом regions (has).
Без замечаний, отличная работа в плане стилистики, лексики и грамматики.
| Аспект | Оценка |
| TA | 8.5 |
| C&C | 8.0 |
| Grammar | 8.0 |
| Vocabulary | 8.5 |
| Общая оценка: 8.5 Критерии оценки |
|